
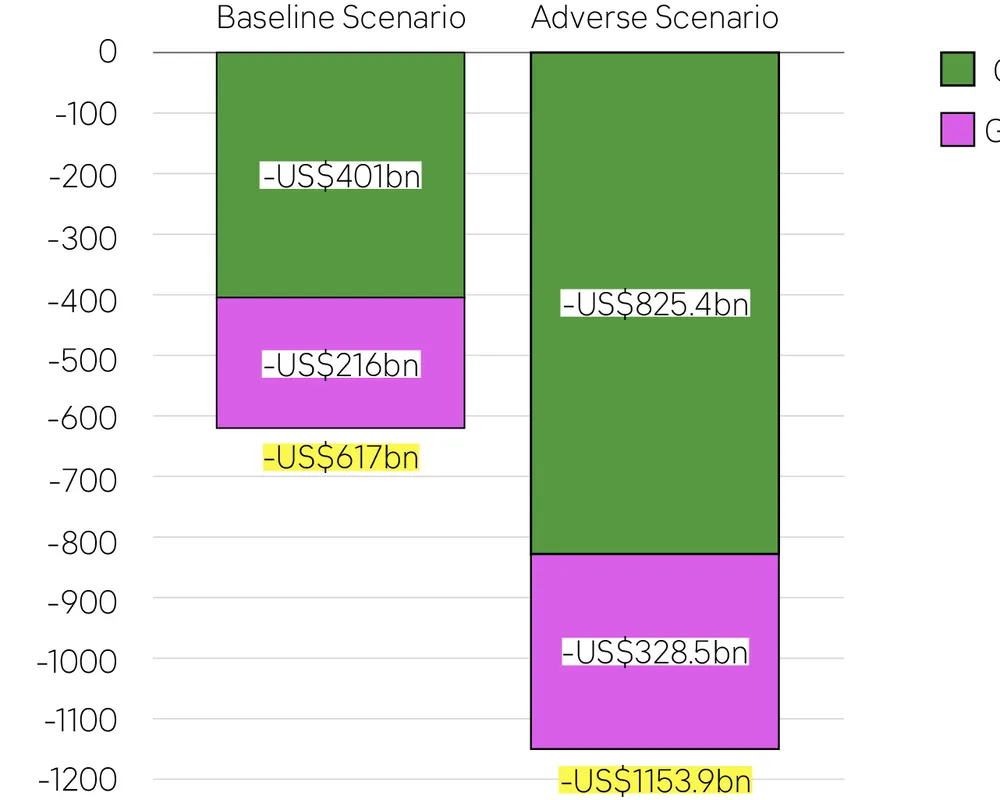
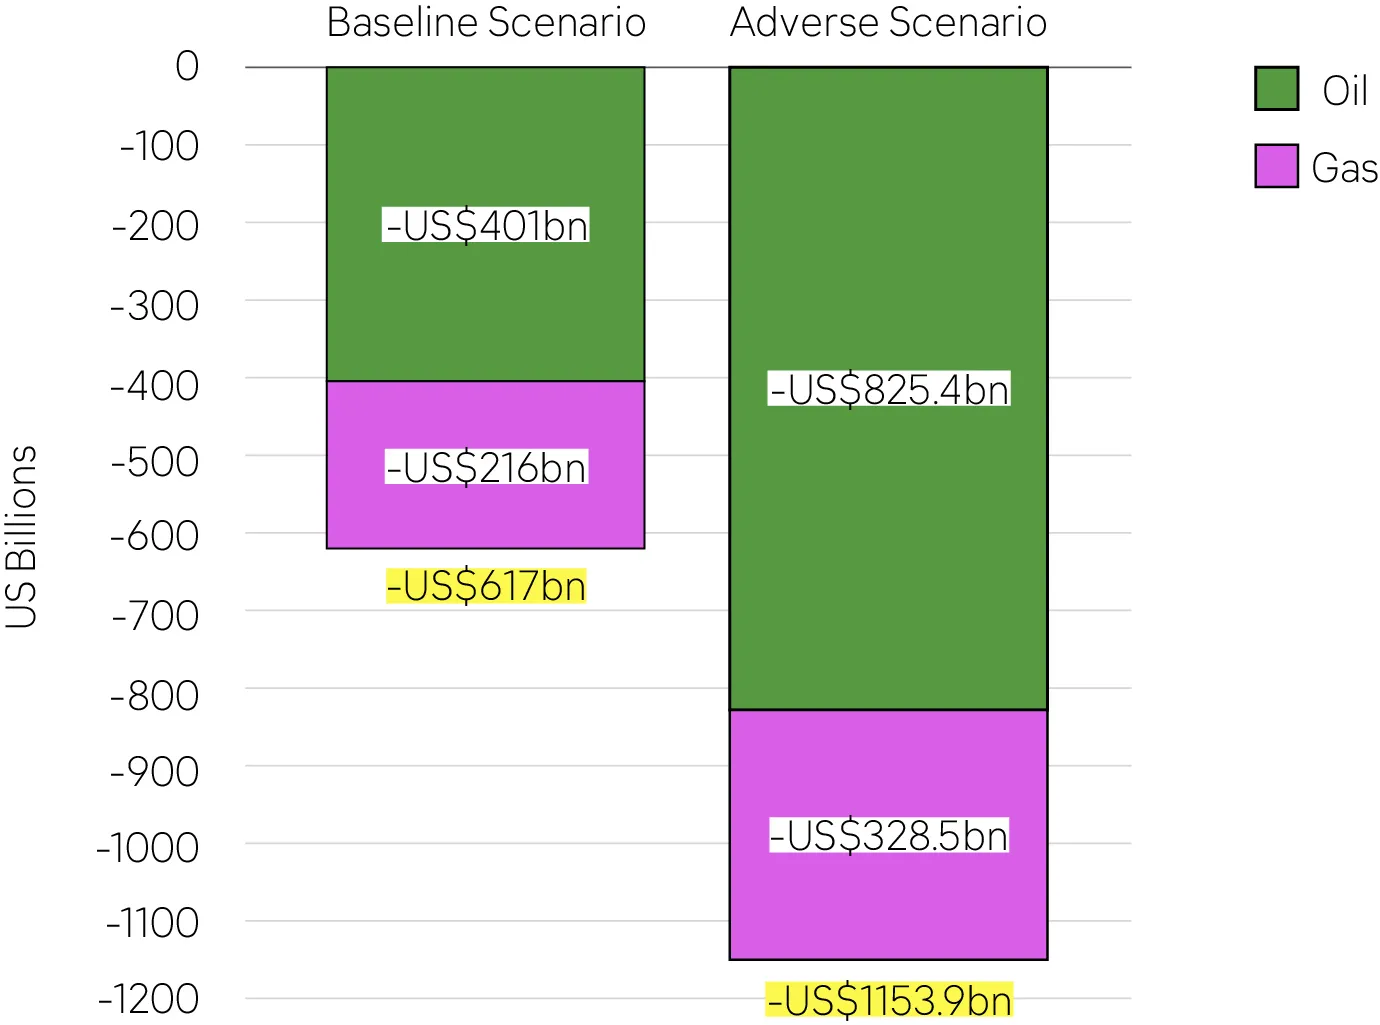
As Shell announces its latest “obscene” profits, climate campaigners at 350.org warn that this lays bare the immense siphoning of money from households, businesses and public budgets to the oil industry – which, based on 350.org’s calculations using IMF pricing scenarios, risks exceeding $1 trillion by the end of the year. End of quarter 1 profits for fossil fuel companies have demonstrated significant increase in profit even after only one month of rising oil and gas prices due to the ongoing war. This widening gap between corporate windfalls and public hardship highlights what campaigners describe as a fundamentally unjust energy system.
Recent analysis by 350.org and reported by the Guardian, shows that elevated oil and gas prices will add up to more than US$600 billion additional cost even if the Strait of Hormuz opens up immediately and up to US$1 trillion in additional costs if the blockage continues. [1] On top of soaring energy bills, 350.org also says that households shoulder an extra US$12 trillion each year in “hidden” fossil fuel costs in the form of fossil fuel subsidies, tax breaks, health impacts, and climate damages. In effect, households are paying three times: through their energy bills, through their taxes, and through the escalating impacts of climate breakdown.
Anne Jellema, Executive Director of 350.org, said:
“While people around the world struggle with soaring energy costs, Shell is raking in billions in added profit. The same crisis that is driving these windfalls is pushing millions closer to hunger and hardship. Governments must act now to tax these excess profits and use the money to protect vulnerable households and expand affordable, homegrown renewable energy.”
The findings also highlight the broader economic ripple effects of fossil fuel dependence, including rising inflation, increased food and fertilizer costs, and slowing economic growth, impacts that disproportionately affect the most vulnerable communities.
NOTES TO EDITOR
- 350.org’s analysis is based on oil and gas pricing scenarios of the International Monetary Fund’s April 2026 World Economic Outlook as well as pricing outlook of Goldman Sachs and global consumption data and weighted price averages as well as reduced demand due to higher prices and rationing measures.
- The analysis takes a deliberately conservative approach in estimating total losses:
- It does not include wider knock-on effects such as higher food and fertilizer costs, broader inflation, or reduced economic output.
- It compares rising prices against the price level in the week before the Iran war, e.g. Brent crude at USD 72 per barrel, a price that was already above levels seen in the preceding weeks and months of 2026 and likely already reflected market fears of disruption in the Middle East. This means the true economic impact is plausibly even significantly higher.
- Reduced demand resulting from higher prices and rationing is already accounted for.
- To calculate gas costs weighting observed regional price increases and projections across regions were used according to consumption levels.
- Figures may vary slightly due to rounding, including converting units such as cubic meters into energy (EJ and MWh).
Baseline Scenario
Component
Formula
Data used
Result
First-month additional oil cost
Oil use × 30 days × price increase
103.5m b/d × 30 × $25
$77.6bn
First-month gas cost
Monthly gas use × 30 day × weighed price increase
3.62bn MWh × $10
$36.2bn
Subtotal first month
Oil + gas
$77.6bn + $36.2bn
$113.8bn
Second month additional oil costs
Oil use × 30 days × price increase × 95% (reduced demand)
103.5m b/d × 30 × $23 × 0.95
$67.8.bn
Second month additional gas costs
Monthly gas use × × price increase × 95% (reduced demand)
3.62bn MWh × × $7 × 0.95
$24.1bn
Intermediate Total
First month + additional period
$113.8bn + $67.8.bn + $24.1bn
$205,7bn
Additional oil cost rest of 2026, baseline scenario
Oil use ×
247 days
× price increase × 95% (reduced demand)
103.5m b/d × 247 × $10 × 0.95
$255.6bn
Additional gas cost rest of 2026, baseline scenario
Monthly gas use × (247/30) × weighed price increase × 95% (reduced demand)
3.62bn MWh × 247/30 × $5.5 × 0.95
$155.7 bn
Gross TOTAL
Previous additional cost + projected additional cost for oil and gas
$205,7bn + $255.6bn + $155.7
$617bn
Uncertainty downward
Gross total × 95–100%
$586 bn- $617bn
Adverse Scenario
Component
Formula
Data used
Result
First-month additional oil cost
Oil use × 30 days × price increase
103.5m b/d × 30 × $25
$77.6bn
First-month gas cost
Monthly gas use × 30 day × weighed price increase
3.62bn MWh × $10
$36.2bn
Subtotal first month
Oil + gas
$77.6bn + $36.2bn
$113.8bn
Second month additional oil costs
Oil use × 30 days × price increase × 95% (reduced demand)
103.5m b/d × 30 × $23 × 0.95
$67.8.bn
Second month additional gas costs
Monthly gas use × × price increase × 95% (reduced demand)
3.62bn MWh × × $7 × 0.95
$24.1bn
Intermediate Total
First month + additional period
$113.8bn + $67.8.bn + $24.1bn
$205,7bn
Additional oil cost rest of 2026, adverse scenario
Oil use × 247 days × price increase × 95% (reduced demand)
103.5m b/d × 247 × $28 × 0.95
$680.0bn
Additional gas cost rest of 2026, adverse scenario
Monthly gas use × (247/30) × weighed price increase × 95% (reduced demand)
3.62bn MWh × 247/30 × $10 × 0.90
$268.2 bn
Gross TOTAL
Previous additional cost + projected additional cost for oil and gas
$205,7bn + $680.0 + $268.2bn
$1153.9bn
Uncertainty downward
Gross total × 95–100%
$1096.2bn – $1153.9bn
Related press releases

As scientists confirm climate change’s role in Nepal disaster, rich nations must pay for Loss and Damage
The Energy Security We Need Is Already Here: Five Frontline Stories of Renewables in Action
